At the end of the year, net revenue reached R$2.3 billion, up by 36% compared to the previous year. Net Income totaled R$231 million, with Return on Equity (ROE) reaching 13%. Due to land acquisition throughout the fiscal year, we generated R$36 million in Operating Cash. The Financial Result had a positive balance totaling R$64.7 million in the fiscal year, and the Net Income closed the fiscal year at R$231.2 million, up by 8% compared to R$214 million in 2020.
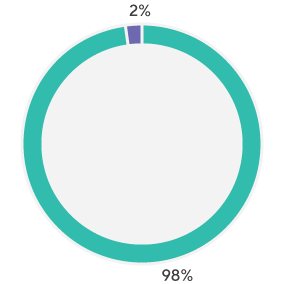
Gross Revenue Breakdown

Property Sales Revenue
Revenue from Sales of Services
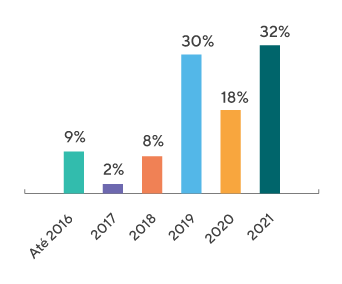
Gross Revenue from Property Sales by Year of Launch (%)

Up to 2016
2017
2018
2019
2020
2021
In 2021, the rating agency Standard & Poor's Global Ratings (S&P), one of the largest in the world, raised Even's rating from brAA to brAA+, with a positive outlook, on the National Brazil Scale. According to S&P, if we maintain the operating results, there will be a further rating upgrade in the short term. Among the factors that led the agency to raise our rating are the improvement in credit metrics, the solid capital structure, consistency in profitability and stronger liquidity to overcome possible economic crises that Brazil may face.
| 2019 | 2020 | 2021 | |
|---|---|---|---|
| Direct economic value generated (Rvenues) | 1,964,778 | 1,763,195 | 2,275,744 |
| Economic value distributed | 1,630,008 | 1,504,193 | 1,916,527 |
| Operating costs | 334,770 | 259,002 | 359,217 |
| Employee wages and benefits | -105,666 | -90,519 | - 86,402 |
| Payments to providers of capital | -54,837 | -42,152 | - 109,922 |
| Payments to government | -95,598 | -125,014 | - 41,931 |
| Community investments | 99,504 | 131,826 | 226,536 |
| Economic value retained | 97,661 | 70,537 | 105,784 |
| Items | Unit | 2019 | 2020 | 2021 |
|---|---|---|---|---|
| Net Operating Revenue | R$ thousands | 1,912,997 | 1,671,020 | 1,732,194 |
| Gross Income | R$ thousands | 475,776 | 482,438 | 483,156 |
| Ajusted Gross Margin | % | 30.7% | 31.9% | 29.1% |
| Net Profit | R$ thousands | 119,191 | 14,688 | 189,450 |
| Net Margin before Minority Interest | % | 7.5% | 3.2% | 12.8% |
| Items | Unit | 2019 | 2020 | 2021 |
|---|---|---|---|---|
| Total Assets | R$ thousands | 4,983,545 | 5,176,777 | 5,867,100 |
| Equity | R$ thousands | 1,877,442 | 2,481,417 | 2,575,635 |
| Items | Unit | 2019 | 2020 | 2021 |
|---|---|---|---|---|
| ROE* | % | 7.2% | 12.6% | 16.6% |
| Items | Unit | 2019 | 2020 | 2021 |
|---|---|---|---|---|
| Gross Debt | R$ million | 1,207 | 453 | 351 |
| 2019 | 2020 | 2021 | |
|---|---|---|---|
| TCA¹ Compliance | R$ 312,867.49 | R$ 296,207.66 | R$ 419,868.92 |
| R$ 239,659.83 | R$ 172,000.00 | R$ 236,500.00 | |
| R$ 75,827.84 | R$ 17,000.00 | R$ 17,000.00 | |
| Subtotal | R$ 628,355.16 | R$ 485,207.66 | R$ 673,368.92 |
| SMT/CET² Compliance | R$ 0.00 | R$ 0.00 | R$ 0.00 |
| Subtotal | R$ 0.00 | R$ 0.00 | R$ 0.00 |
| DECONT/CETESB³ Compliance | R$ 1,744,731.20 | R$ 1,169,660.04 | R$ 896,985.78 |
| R$ 53,698.50 | R$ 4,839.50 | R$ 0.00 | |
| R$ 63,171.00 | R$ 0.00 | R$ 0.00 | |
| Subtotal | R$ 1,861,600.70 | R$ 1,174,499.54 | R$ 921,985.78 |
| Total | R$ 2,489,955.86 | R$ 1,659,707.20 | R$ 1,595,354.70 |
¹ Compliance with the Environmental Commitment Term (TCA)
² Compliance with the Road Improvement Agreement (SMT/CET)
³ Compliance with the Environmental Quality Term (DECONT / CETESB)