We were pioneers in carbon neutralization in the real estate market. By 2021, we have neutralized 184,000 tons of CO2 over 47 works. Of this total, 17,000 tons came from the project to transform methane into biogas in sanitary landfills. In previous years, the programs were linked to projects in the Amazon.
Despite the concern with the subject, world studies and the current climate scenario revealed that the civil construction segment accounts for only 5% of total emissions. According to our inventories, the average CO2 e index (or “CO2 equivalent”, which is the sum of all GHG-Greenhouse Gases) was 178.12 kg of CO2 per square meter built in 2021 (within this index, scopes 1, 2 and 3 are already considered).
In parallel, we have implemented other sustainable and GHG mitigation practices in recent years, especially the Urban/Arauna project, located in the municipal landfill of São José dos Campos in the State of São Paulo. At the landfill, biogas is burned to reduce the amount of GHG in the atmosphere and, consequently, contribute to the mitigation of climate change. The landfill receives 700 tons of waste every day and captures 147,185 tons of CO2 annually.
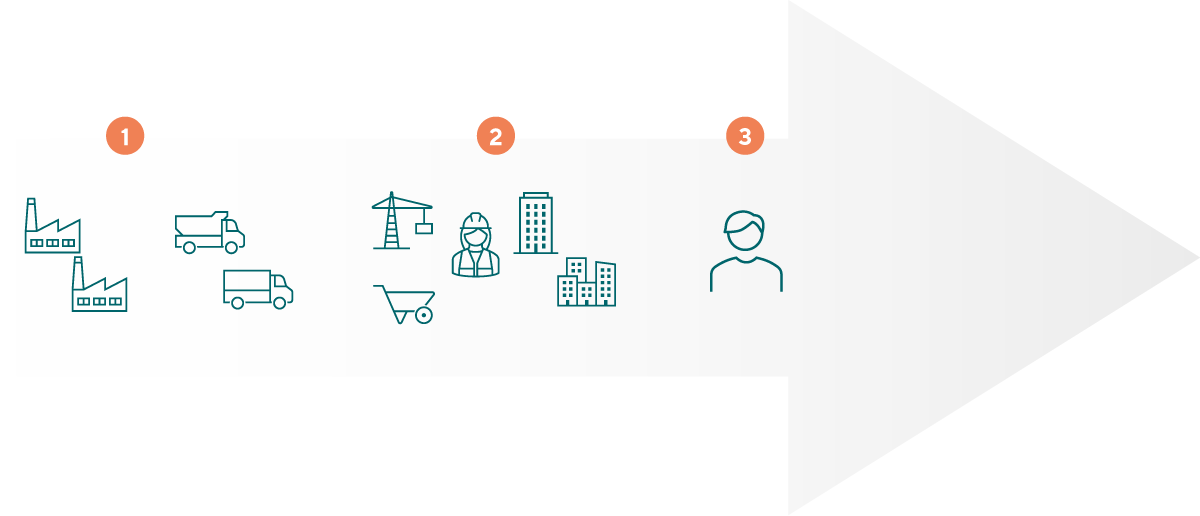
The largest amount results from emissions from manufacturers of the materials we use in the construction works (plus their transport). As a result, we take into account prices and delivery conditions when choosing suppliers and the way they position themselves in terms of sustainability. We are looking for suppliers that have sustainable and approved materials. Faced with the difficulty in validating and auditing the data sent by these partners, we used the Sinduscon Methodological Guide to calculate the emissions inventory included in the budget of each development.
To quantify, monitor, report and verify our emissions, we adopted the same methodology used in the ISO 14064 certification, and we intend to implement the CE Carbon tool, recently launched by Sinduscon. The goal is to assess if the emission factors are far from reality or close to material manufacturers, which is a determining issue in the engagement process.
Intending to be carbon neutral, we put in place several procedures, particularly dividing inputs and materials into 40 groups, which allowed us to prepare specific surveys on quantities and ways to reduce emissions. Based on this study, the company began to act punctually to reduce emissions in each group.
| Type of emission | 2019 | 2020 | 2021 |
|---|---|---|---|
| Direct emissions (Scope 1) | 47.46 | 26.93 | 73.58 |
| Energy indirect (Scope 2) | 102.89 | 178.56 | 350.07 |
| Other indirect emissions (Scope 3) | 32,732.59 | 17,861.04 | 15,638.39 |
| Total | 32,882.94 | 18,066.53 | 16,062.04 |
| Index kgCO2e/m² | 171.84 | 153.94 | 178.12 |
Indirect Emissions
CO2e

CO2e

Indirect Emissions
CO2e

Neutralizing total emissions
DELIVERY OF THE DEVELOPMENT
