Based on an analysis of environmental legislation and the adoption of internal procedures, we developed a policy aimed at reducing and properly disposing of waste and materials. This policy includes sending waste only to recyclers and avoiding landfills as much as possible; ensuring the greatest possible use of materials; implementing reverse logistics projects; work on raising awareness among suppliers and society around the work on the importance of segregating recyclable waste. Since 2020, we have implemented the control of receipt of materials in an online format in our construction sites, which guarantees control and tracking with invoice and quality seals.
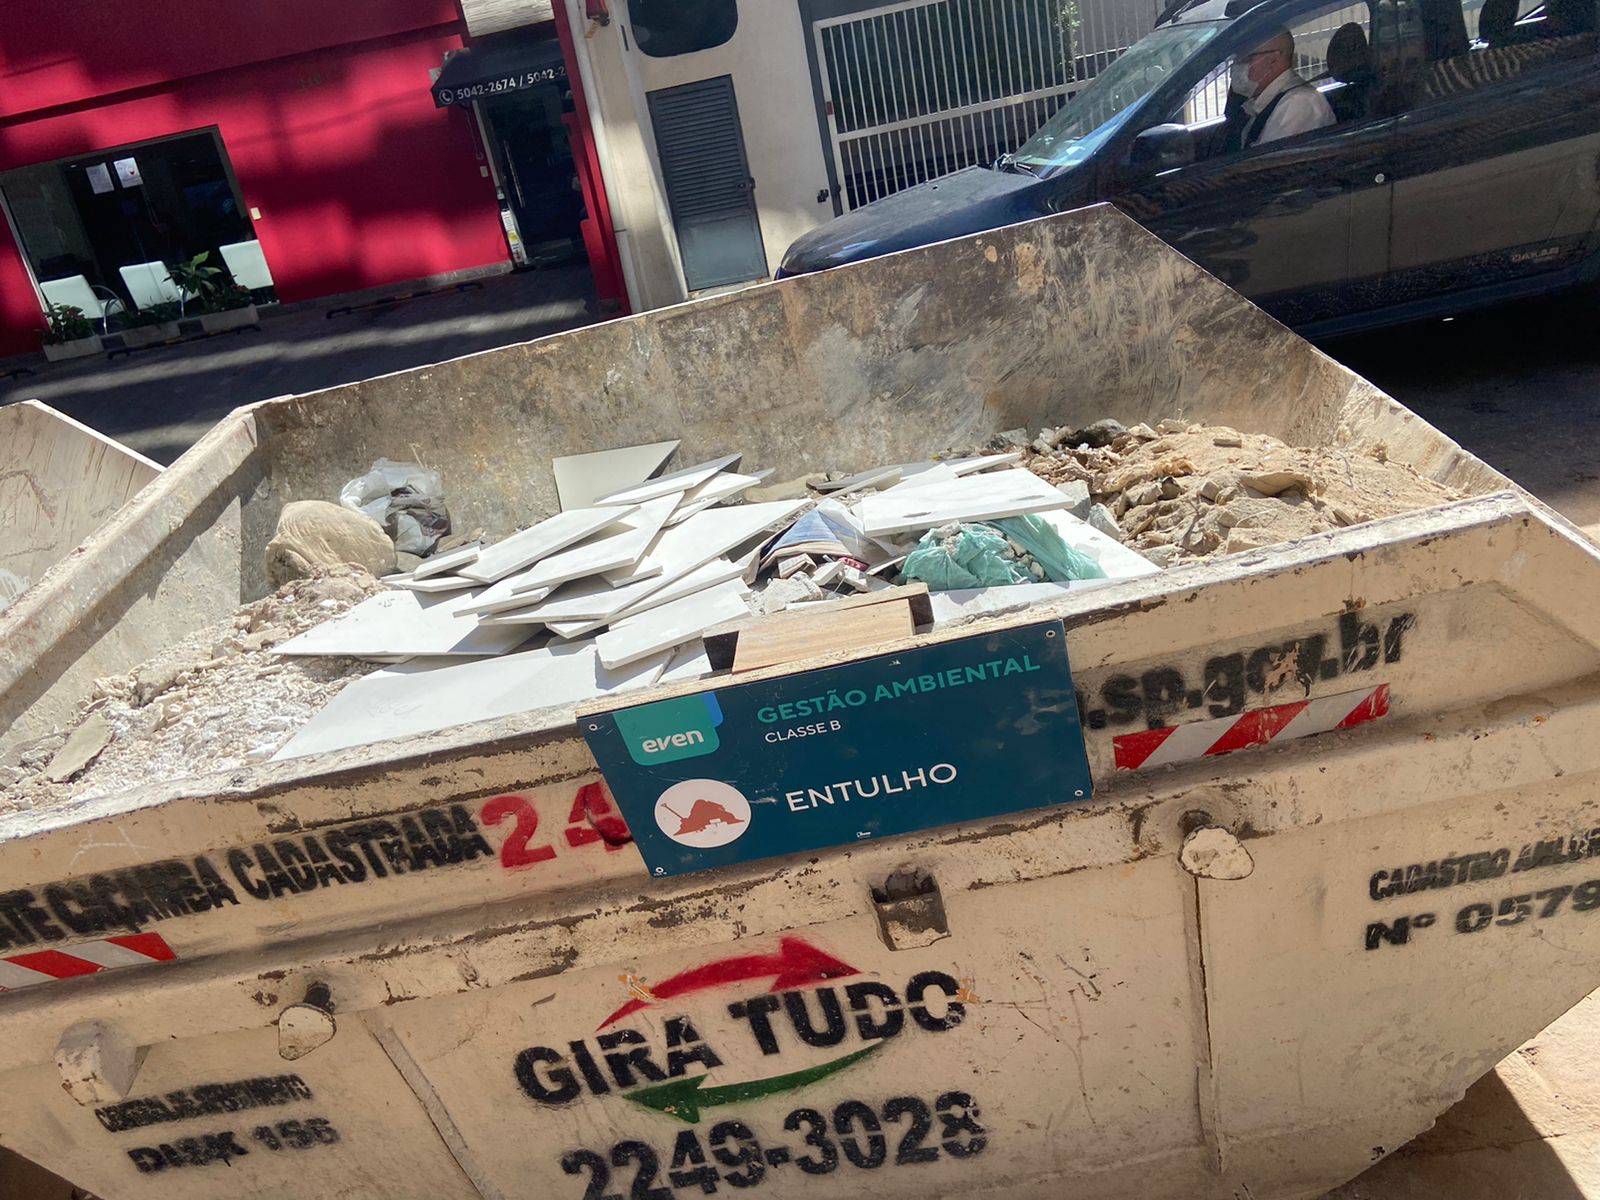
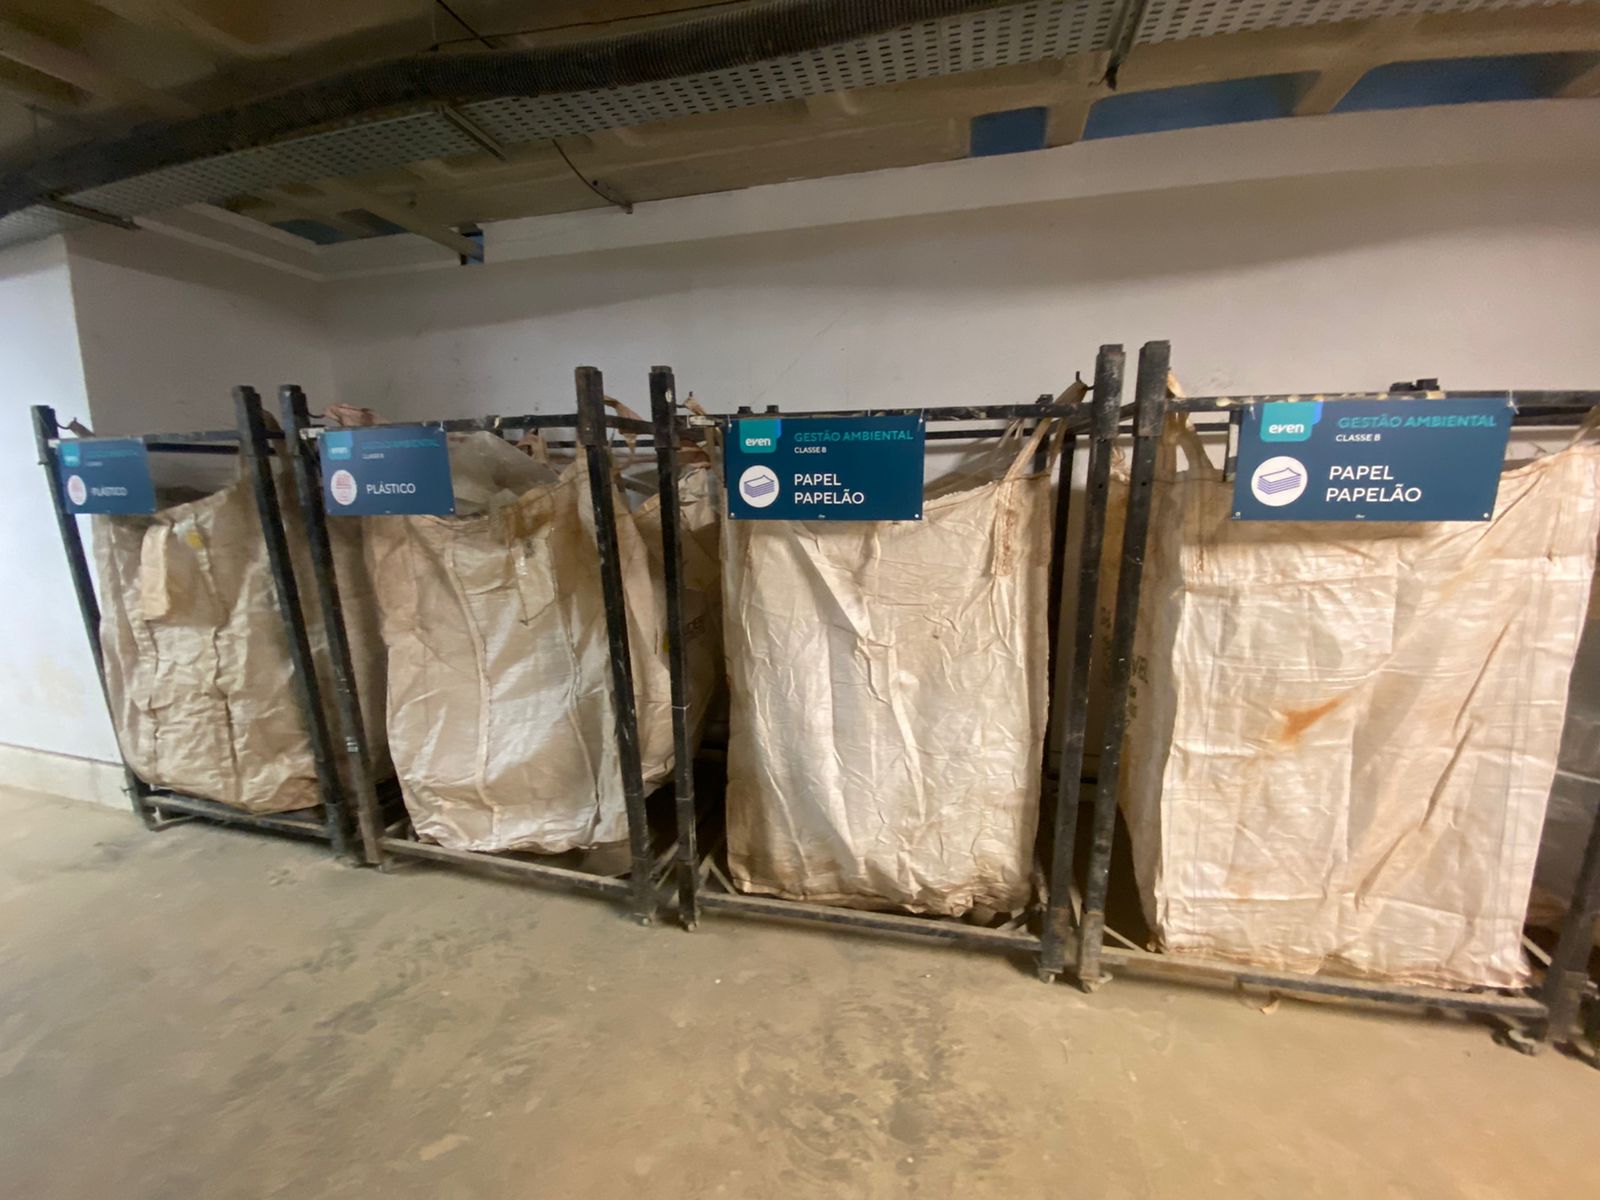
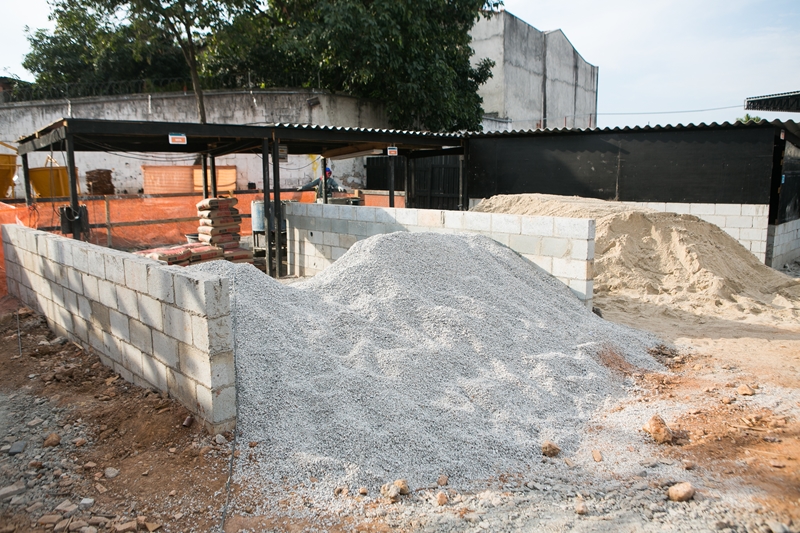
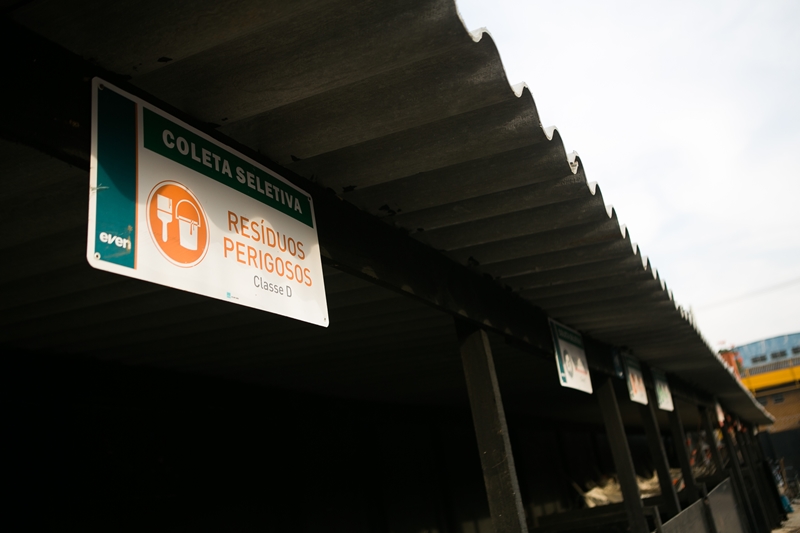
For the storage of different types of waste (organic, recyclable and toxic), we follow Exhibit I of Law 16642, according to which every building to be built with an area greater than 750 m2 must be provided with compartmentalized shelter, sufficiently dimensioned, and with external access to facilitate collection. We also adopted the CDF (Certificate of Final Destination) for waste generated in construction, such as waste recycling plants, cement industry, and biomass factories.
Monthly monitoring via the PDTO Portal (Program for Technical Performance of the Construction works) and internal audits allowed expanding the capacity to manage the processes and routines of the construction sites. Continuous assessments and approvals are carried out at the construction sites for buckets, earthworks, and waste disposal suppliers. Since 2015, we have had a technical team responsible for checking compliance with all items. This team includes professionals in the areas of Quality, Sustainability, Supplies and construction engineers.
All transporters and receivers of waste generated at our sites must have the necessary environmental documentation and receive periodic visits and inspections by a professional selected by Even's Quality department.
In 2021, we implemented the Sigor System as a standard for managing the collection of recyclable and hazardous waste at all construction works and for reverse logistics to decentralize the process of removing land between construction works and ensuring autonomy with separate contracting the excavation and earthworks process.

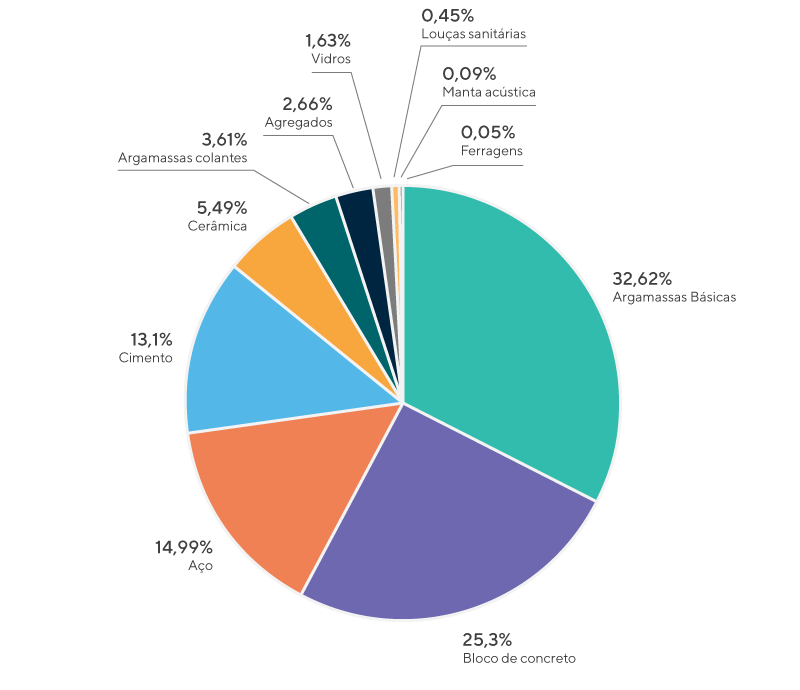
| Materials used | GRI 301-1 | Measurement Unit | 2019 | 2020 | 2021 |
|---|---|---|---|---|
| Non-Renewable Materials Used | ||||
| Steel | t | 1,579.87 | 6,292.60 | 6,588.38 |
| Block | t | 6,405.43 | 17,576.44 | 418.78 |
| Cement | t | 3,090.30 | 4,055.85 | 5,492.51 |
| Ceramics | t | 64.65 | 197.57 | 267.43 |
| Basic Mortars | t | 2,917.32 | 8,133.62 | 20,407.43 |
| Adhesive Mortars | t | 1,314.83 | 410.51 | 1,758.91 |
| Glasses | t | 479.69 | 337.89 | 753.48 |
| Sanitary Ware | t | 75.33 | 98.19 | 263.78 |
| Hardware | t | 5.00 | 10.00 | 30.00 |
| Acoustic Blanket | t | 28.97 | 28.49 | 30.93 |
| Renewable Materials Used | ||||
| Renewable Materials Used | t | 26.54 | 14.34 | 2,528.31 |
Representativeness - Material consumption in cumulative weight 2019/2021
| 2019 | 2020 | 2021 | |
|---|---|---|---|
| Rubbish | 10,641.29 | 7,540.96 | 14,044.78 |
| Wood | 2,592.55 | 2,167.77 | 2,627.37 |
| Plaster | 1,218.70 | 978.25 | 2,705.30 |
| Recyclable | 400.05 | 202.17 | 281.81 |
| Mix | 408.44 | 125.64 | 476.74 |
| Hazardous | 22.91 | 1.09 | 7.30 |
| Total | 15,283.94 | 11,015.88 | 20,143.30 |
| 2019 | 2020 | 2021 | ∆2020/2021 | |
|---|---|---|---|---|
| Hazardous waste - Class I | 22.91 | 1.09 | 7.30 | 569.70% |
| Total diverted from disposal - Hazardous | 0.00 | 0.00 | 0.00 | 0.00% |
| Other disposal operations - Coprocessing | 22.91 | 1.09 | 7.30 | 569.70% |
| Total directed to disposal - Hazardous | 22.91 | 1.09 | 7.30 | 569.70% |
| Recyclable waste (Rubbish, Plaster, Wood and Bags) - Class II | 14,852.59 | 10,889.15 | 19,659.26 | 80.54% |
| Reuse - Biomass production | 2,592.55 | 2,167.77 | 2,627.37 | 21.20% |
| Recycling | 12,260.04 | 8,721.38 | 17,031.89 | 95.30% |
| Total diverted from disposal - Non-hazardous | 14,852.59 | 10,889.15 | 19,659.26 | 80.54% |
| Total directed to disposal - Non-hazardous | 0.00 | 0.00 | 0.00 | 0.00% |
| Non-recyclabel waste - Mix (1) | 408.44 | 125.64 | 476.74 | 279.45% |
| Total diverted from disposal - Non-recyclabel | 0.00 | 0.00 | 0.00 | 0.00% |
| Landfilling | 408.44 | 125.64 | 476.74 | 279.45% |
| Total directed to disposal - Non-hazardous | 408.44 | 125.64 | 476.74 | 279.45% |
| Total weight of waste diverted from disposal | 14,852.59 | 10,889.15 | 19,659.26 | 80.50% |
| Total weight of waste directed to disposal | 431.35 | 126.73 | 484.04 | 281.90% |
| Overall total | 15,283.94 | 11,015.88 | 20,143.3 | 82.86% |
The increase in waste is directly linked to the greater number of works in the finishing phase. This is why there is an oscillation between one year and another. The same applies to hazardous waste, the highest concentration linked to works in the delivery phase. Currently, we have goals to reduce the waste mix, but we aim to study better methods to reduce the amount of waste, regardless of type/class. We monitor the generation via PGRCC of the works and understand each particularity.
| Year | Reverse Logistics Blocks (KG) | Reverse Logistics Ceramic Packaging (KG) | Reverse Logistics Scrap Metal (T) | Reverse Logistics Scrap - Amount Collected (R$) | Reverse Logistics Mortar Packaging (KG) | Reverse Logistics Burnt Lamps (Units) |
|---|---|---|---|---|---|---|
| 2021 | 89,020.00 | 4,200.00 | 45.04 | R$ 12,025.00 | 13,000.00 | 60 |
| 2020 | 8,840.00 | 240.00 | 46.71 | R$ 13,408.00 | 5,380.00 | 72 |
| 2019 | 22,350.00 | 4,050.00 | 54.47 | R$ 26,181.00 | 4,946.00 | 754 |